
 PT
PT ES
ES
So, you have successfully integrated push into your marketing strategy. Your campaign is rolling, you can see some results, but what is happening behind the scenes? How to make sense of your statistics and evaluate performance like a boss?
Today, we are going to discuss numbers and tables, everything you love that much. Let’s take a closer look at important push notifications metrics and see how to analyze them properly. This will help you understand your performance deeper and the most crucial – optimize your campaigns smartly.
Evaluating push notifications metrics at Notix
The Notix statistics tab is pretty straightforward. Here, you can see subscription stats for your entire campaign:
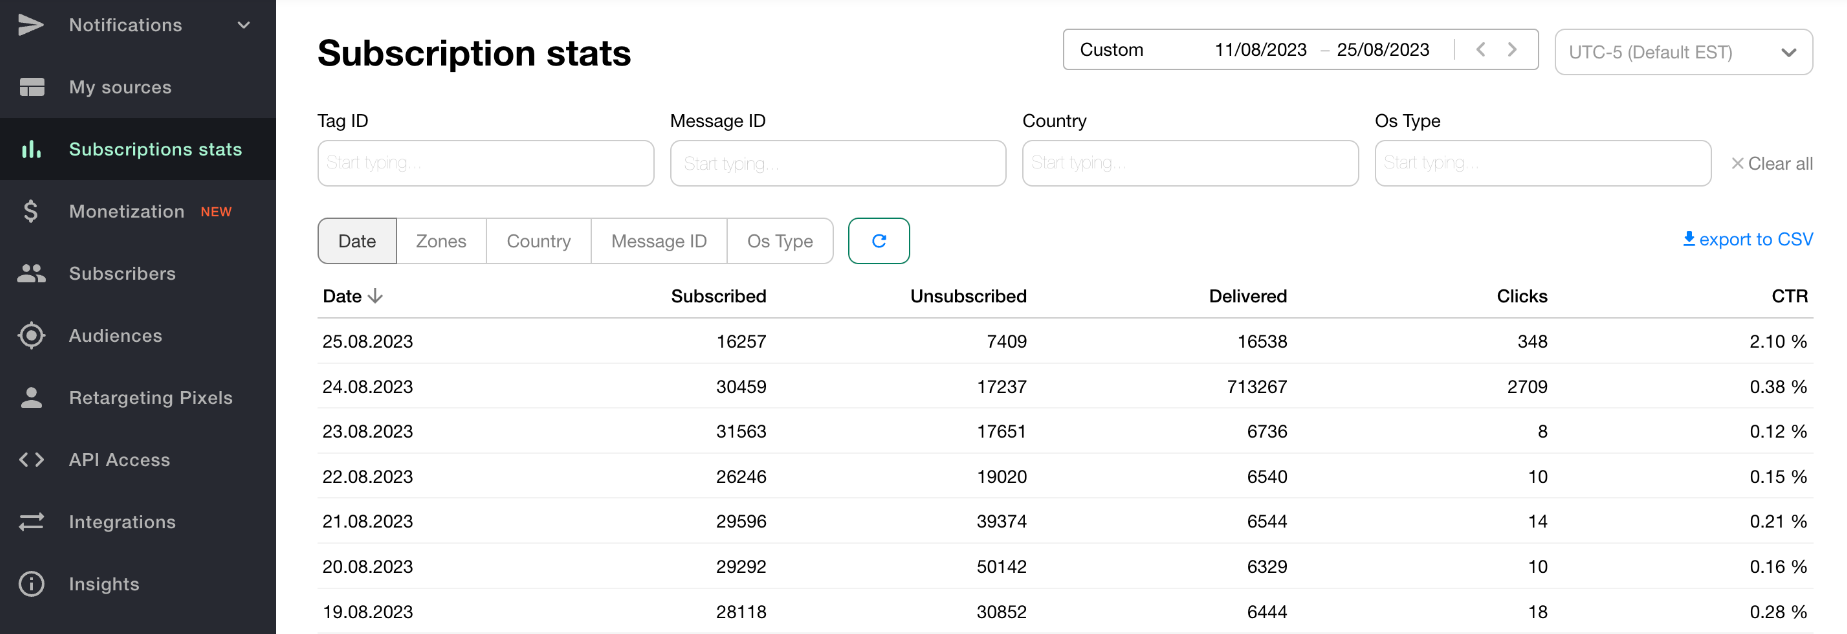
Everything is pretty straightforward here: you see the number of users that subscribed, unsubscribed, how many notifications were delivered, clicks, and CTR, of course. Some of these metrics might need explanations, and we will give them further.
What is more, you can also view statistics for every push notification you send. Here is what it looks like:
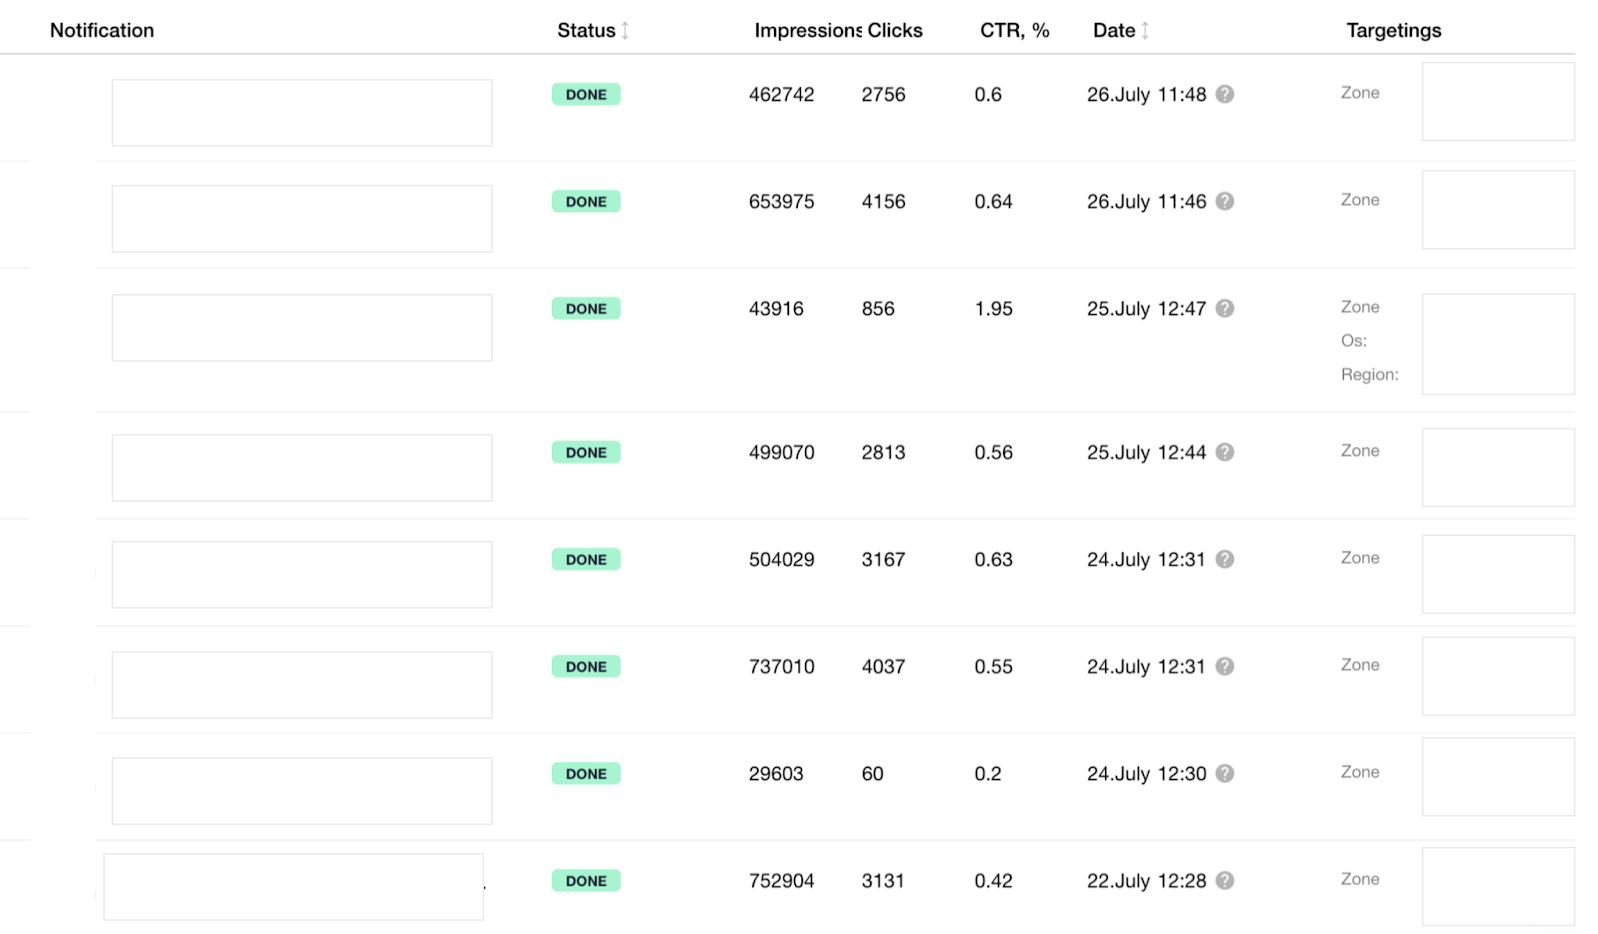
And now a couple of words about the metrics you have seen on these screenshots.
- Delivered
That’s easy – the Delivered table shows how many of your push notifications have actually reached the users.
- Subscribed
This simple metric stands for the users who have accepted an opt-in request pressing “Allow”. As simple as that.
- CTR (click-through rate)
CTR shows how many users clicked a sent notification to see the offer page. Like opt-in rate, this metric also gives information about how engaging your notifications are, plus – it is a perfect metric for a split test on timing and frequency, which you will definitely need.

- Unsubscribed
The unsubscribed rate shows the number of users who disabled push notifications at some point. If you see a high opt-out rate in your statistics, it means that the time has come to perform a split test and see how to improve your strategy. It’s important to see which factors caused unsubscriptions – was it a specific time period, a certain campaign, or anything else.
By the way, at Notix, you can see the number of unsubscribed users when you actively send push notifications (yours or those with ads). It means that if you stop sending them for a couple of days, for instance, and start again in a while, you won’t be able to view the Unsubscription rate for the days you didn’t send anything.
Push notifications metrics for newcomers: tips and insights
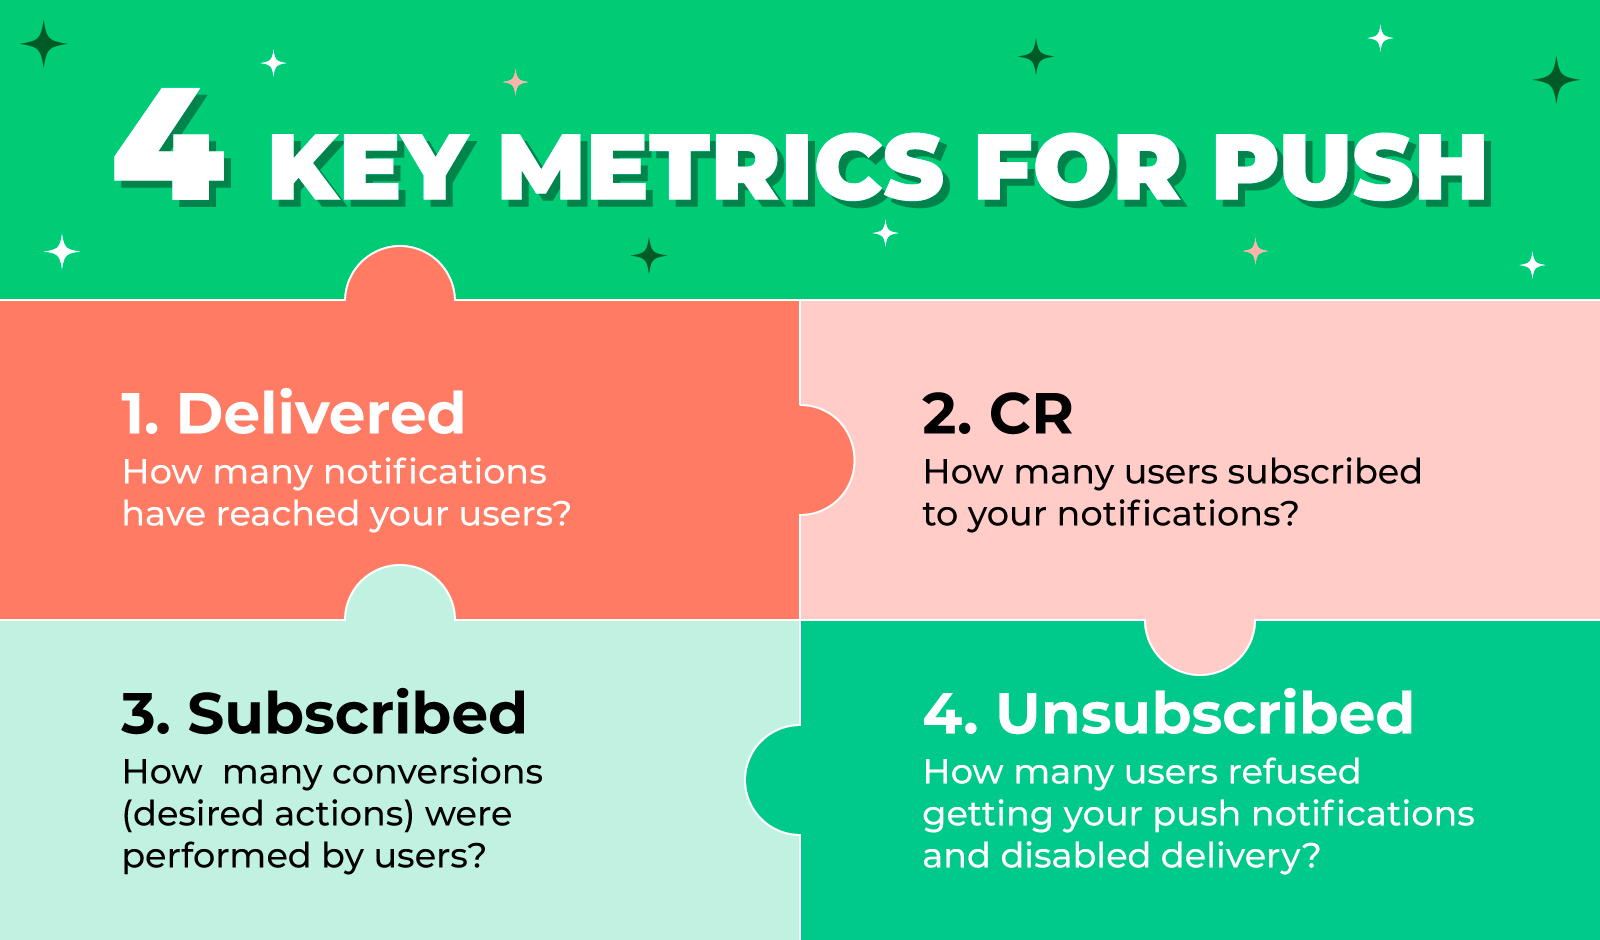
We have some crucial points to share with you. So, first, the main metrics to keep in mind:
These are tips from Diana Sultanova, Senior Business Development Manager at Notix:
Segmentation
One of the main recommendations to help you keep your metrics on a high level is to segment users into different audiences. We recommend dividing your audiences not only by interests and demographics, but also by their actions on the website. Say, it’s a great idea to place users who have clicked your notifications into a separate category.

Understanding CTR
Most of you might have a question about CTR: which is considered a successful one? Well, if we talk generally, and even abstractly, a really amazing CTR might be 3% and even 5-6%.
However, this is not something you should chase for. Instead of comparing your results to spherical cows in a vacuum, compare the CTR of different notifications inside your campaign and make conclusions. This is the only right way to make sense of data.
Let’s see an example:
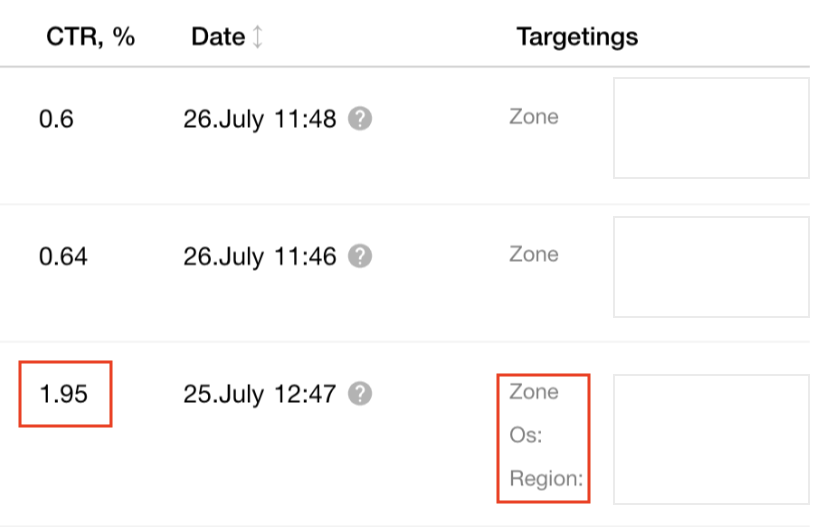
Already see the connection between CTR and targeting? Two previous push notifications had only targeting by zones, which is too broad. While the most successful one has targetings by zone, OS, and region, being more narrow. And this is exactly the reason why it brought 1.95%, more than 2 times higher than the rest.
Planning and content
Last, but not least, mind the right timing, frequency, and content for every audience you have. Yes, yes, we all know how important it is to consider such parameters of your campaign, but we just wanted to remind you about that.
So when you know how to deal with your statistics like a pro, just arm yourself with these recommendations and let your campaigns be even more thoughtful and, therefore – profitable!